Understanding The Online Player Pool
Monday, 28 October 2013
By James 'Splitsuit' Sweeney
Most online poker players already explore their own stats and results using tracking tools such as the very popular PokerTracker 4, but have you ever considered analysing the entire pool of players that you have ever encountered in your database? Your PokerTracker 4 database has perfect recall and can remember hands and stats that you’ve totally forgotten, making this a unique advantage over playing without a tracker, or even while playing online. It is unfortunate that most players don’t use their database to further understand the games they play in. This is why I want to teach you how to start analysing the entire player pool to gain a better understanding of who your average opponent is.

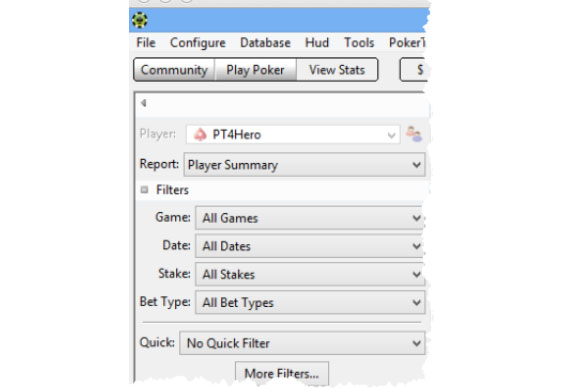
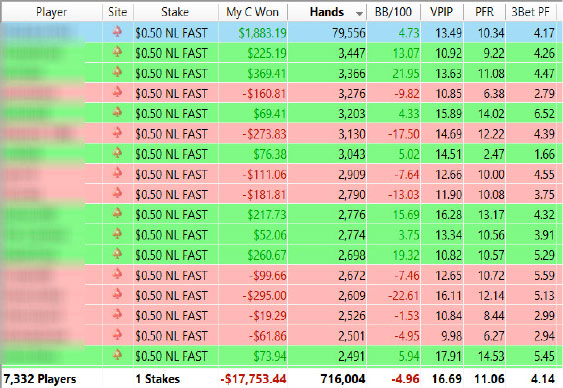
Let’s first start by checking out each player in our database using a report that lists each player alongside key results and basic stats. To do this in PokerTracker 4 go to View Stats > Results and then select the Player Summary report from the dropdown menu in the left hand frame. The report will bring up each player in your database sorted by screen name, but to accomplish our goals we can choose other sorting options such as by money won, number of hands, VPIP, etc. I like to first note the average VPIP/PFR/3Bet at this stage, and you can see that below in the report’s summary row. In this full ring database we see the average player Voluntarily Puts Money in the Pot (VPIP) 17% of the time, raises pre-flop 11% of the time (PFR) and 3-bets 4% of the time.

This summary row gives us a great glimpse about the average player in our database and also allows us to quickly see how the regulars in our games play. Simply sort it by hands and see who the regs in your game are and check out their basic stats.
If you want more specific analysis, you can use a filter to find players who played a minimum number of hands in a session by using the Session Details filter group and set the Table Session Duration filter to whatever range you desire. I commonly use the Hands Between option and set it to find players who have between 1,000 and 10,000,000 hands in the database when I want to review just the regs. Don’t forget that you can customise this report to add other stats to review by right-clicking and then selecting Configure Report, or if you want to do extensive data analysis you could export the report as a .CSV and then import it into your favourite spreadsheet application where you can manually manipulate the rows by removing certain players as needed. This report is very powerful, so be sure to take full advantage of the flexibility that PokerTracker 4 provides during your player pool review.
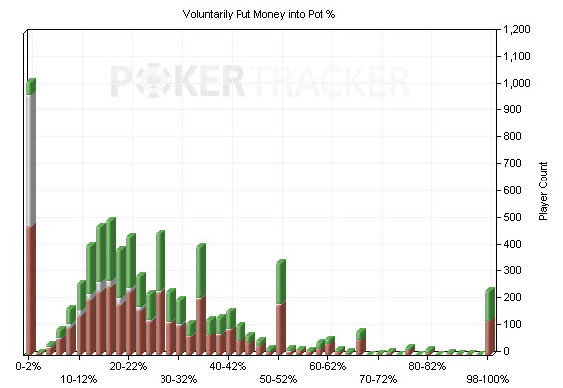
A Player Summary report is not the only way we can review the player population. We could also graph our entire database to review a specific stat to see how the player population responds. To do this, select View Stats > Graphs and then select the Global Player Statistics graph from the left hand drop down menu. The next step is to choose the stat you wish to analyse. For this first example, let’s choose VPIP and we’ll start with one minimum hand and 3bb/100 as the breakeven point. The breakeven point shows the difference between losing and winning players in the graph within a median range to account for variance. Using our example a 3bb/100 breakeven player is anyone who is losing less than 3bb/100 but not winning more than 3bb/100. Here is what we see:

Notice we have odd spikes in numbers with 0-2% VPIP, 50-52% VPIP, and 98-100% VPIP. This is due to analysing players who could only have one or two hands, which isn’t particularly helpful when analysing regs. So let’s change the minimum number of hands to 500:

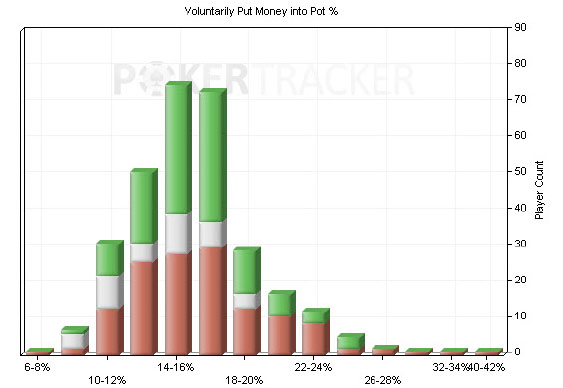
Notice now that we have a more common range of VPIP, with the majority falling between nitty players and tight-aggressive players (TAGs), with some loose aggressive players (LAGs) included as well on the right side of the curve’s “bell”. This anomaly is to be expected as we don’t normally have large sample sizes against fish because these players tend to be transient, while the better opponents tend to be the regulars in the player pool and will appear more in the database. Fish tend to buy-in, use poor bankroll management skills and bust their roll quickly because they play too many hands. They rarely remain if they continue to lose quickly. So the players we tend to have bigger sample sizes on are regulars who, at the very least, are not fish, and thus we can use the minimum number of hands to filter for them specifically, much as we did earlier using the Table Session Duration > Hands Between filter. If you have a smaller database you may lower the minimum hands down to a few hundred, and with a huge database you may increase it to 1,000 or more. These same rules can apply when filtering reports by hand counts.
Analysing a stat like VPIP isn't nearly as useful as analysing a stat like Call Steal. Let's look at Call Steal from both a 500 minimum sample and a 1,000 hand minimum sample:
Notice that the 1,000 hand minimum (on the right) is more focused and narrows to around a 13% average. Also notice that, as we look on the outside of the bell, such as 0-2% and 20-22%, we see a higher concentration of losing players with those stats. This is where that breakeven bb/100 comes into play. As I explained earlier, when we use 3bb/100 as breakeven it means any player higher than 3bb/100 is green, lower than -3bb/100 is red, and anyone between -3bb/100 and 3bb/100 is breakeven (or grey on this graph). This is great way to visualise winning versus losing players given the averages of a stat.
While this is just a precursor to using your database to analyse the player pool at large, it’s the stepping stone to doing in-depth analysis on the playing style of the “regs” in your games and other definable player types. Use your database to understand typical stat ranges for regs and non-regs and compare your own stats/ranges to them. If the average player in your game is squeezing at 4% and you are squeezing at 8%, then it’s important to review the profitability of your squeezing strategy. Keep in mind that this process is not everything you need to do while studying the game, but there is no doubt that player pool analysis is a powerful tool to explore and one that will help you to get a better idea on your opponents as a whole.
Good luck and happy grinding!
James Sweeney is a noted poker coach, and author of the book
"Dynamic Full Ring Poker: Beyond the Basics" published by Daily Variance. James contributed to the tutorial content development and support of
PokerTracker 4, and remains an active player advisor to the PokerTracker management team. His single-serve coaching video content is available at
splitsuit.com.